Research Osnabrück University of Applied Sciences
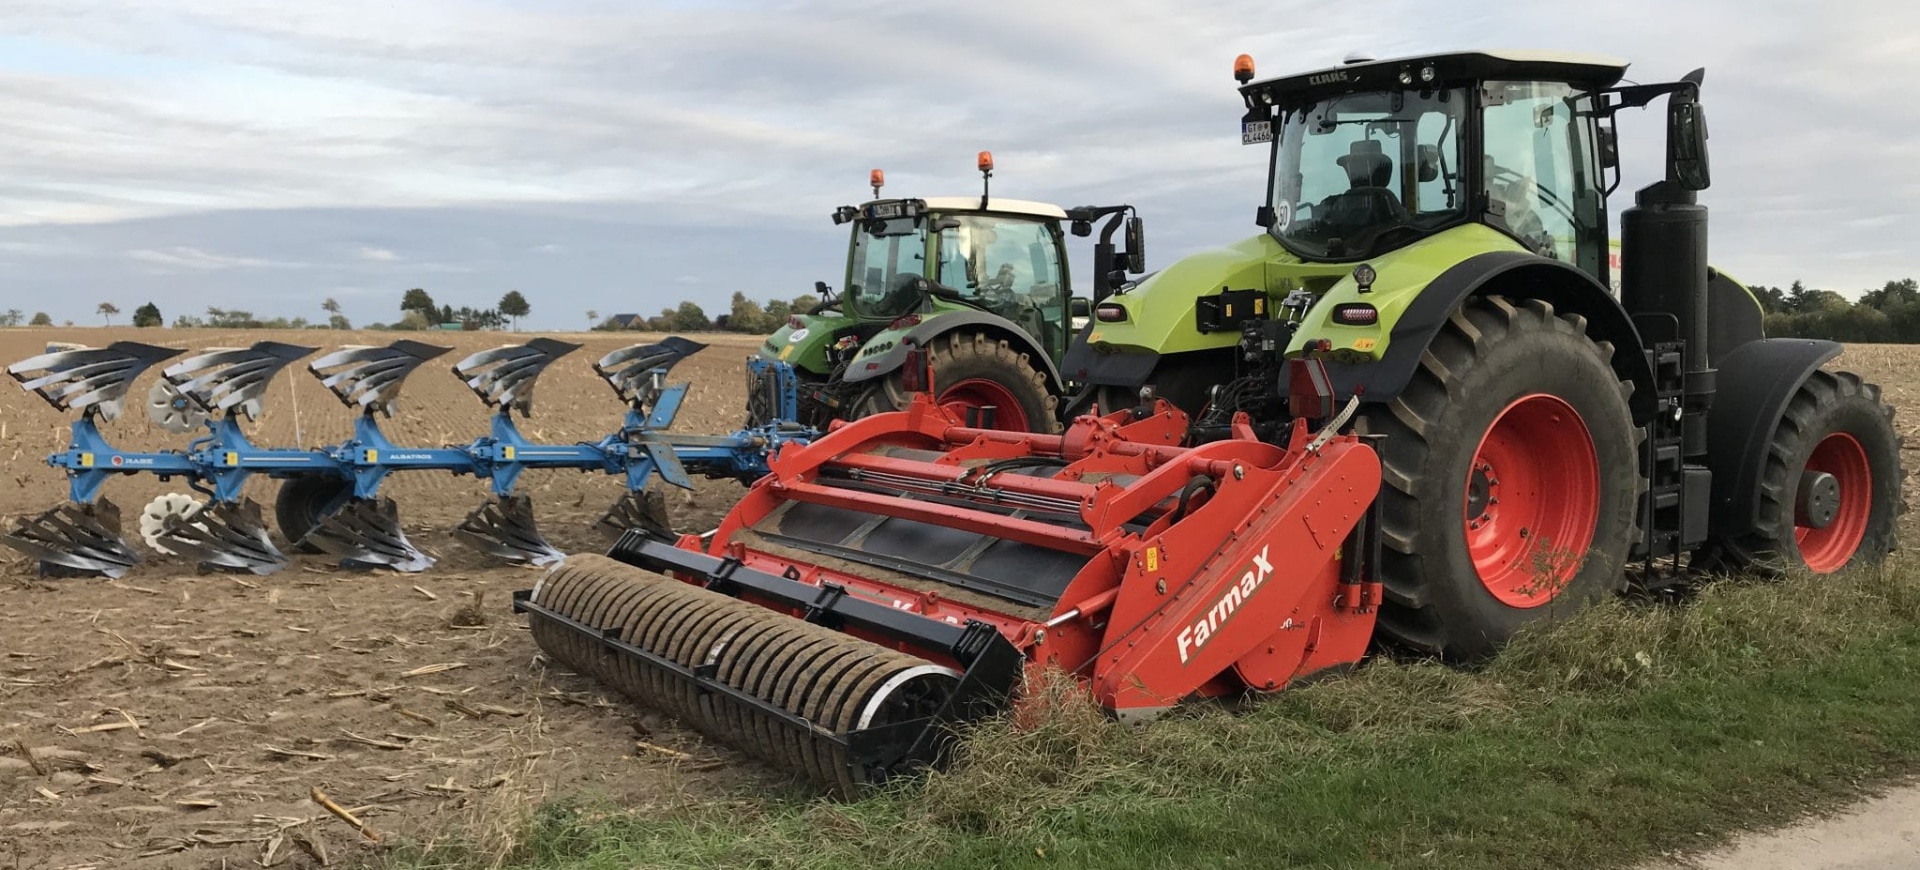
Near Hamburg (Germany), the Osnabrück University of Applied Sciences performed multiple practical studies with a Farmax spading machine and Rabe plough. The research question for the study that was started in 2018 was: ‘Can the spading machine compete with a plough?’. This research question was taken in the broad sense, meaning economical and ecological differences were investigated.
Osnabrück University of Applied Sciences
The Osnabrück University of Applied Sciences is a versatile University of Applied Sciences that is strongly represented in the (inter)national agricultural sector. This University of Applied Sciences initiates many important studies that have great influence when it comes to the independent provision of information for the agricultural sector and the authorities in Germany. Since the University of Applied Sciences has a good reputation, Farmax started exploratory talks with Professor H. Korte (Engineering) and, later, Professor R. Anlauf (Soil & Plant Sciences) in order to compare spading with ploughing. Spading is a well-known concept in the vegetable cultivation sector in Germany, though the possibilities and application of spading are still relatively unknown in the German arable industry. For this reason, the University of Applied Sciences saw challenges to test this relatively ‘new’ method of soil preparation in practice.
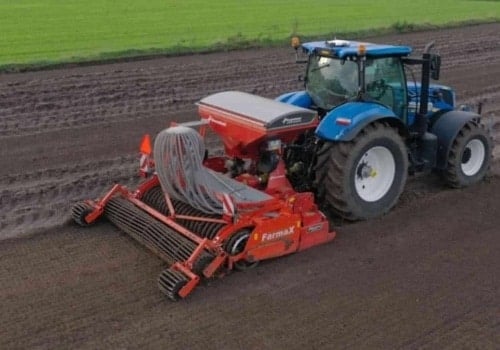
Through research, the team wants to further investigate the diesel consumption, soil structure, plant growth, the mixing of organic materials and the economic aspects. In preparation for the study, Wasse B.V., in cooperation with Farmax, supplied a Farmax LRP Profi 300 with ring roller. After various preliminary studies, the first practical test was initiated in September 2018 by student Mario Sandmann at the test plot near Hamburg. The soil of a 5-hectare test plot was prepared using the Farmax spading machine and a 5-share plough with mouldboard.
Every 30 metres (32.8 yards), the method of soil preparation was switched. This was done to minimise the soil difference in the plot as much as possible. Spading and ploughing was performed on the same day. Fertilisation and spraying were done simultaneously on the various test strips.
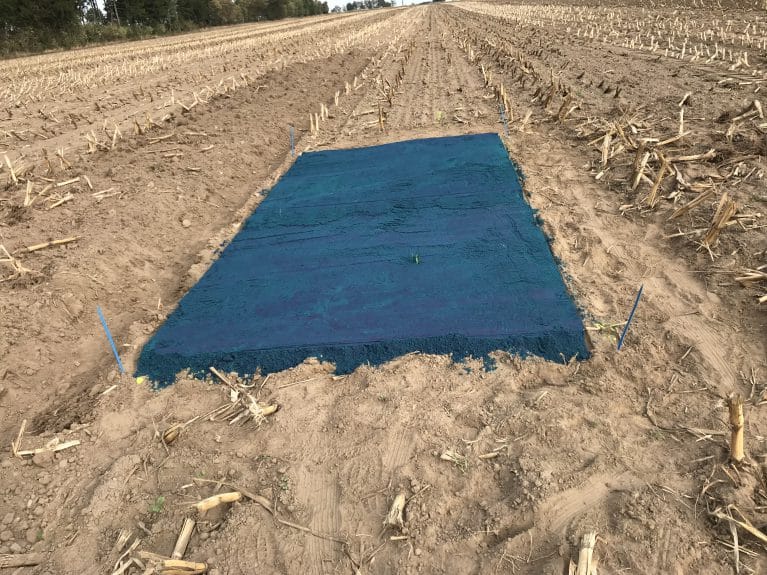
The soil preparations were performed by the research team, so any influence by external parties was prevented. The crop rotation on the plot involved winter wheat, and the crop remains were silage maize. The mixing performance of the machines was measured by applying a layer of sand coloured with a biological colourant.
Results
The first results were measured in the autumn of 2018, when the crops emerged. Before the crop emergence, the study group investigated the mixing performance for spading and ploughing and made a cost calculation of the soil preparation methods.
In image 1: Soil visualisation for ploughing and image 2: Soil visualisation for spading, you can see the colour differences between ploughing and spading. During the practical test, photos were taken of the horizontal cross sections of the ploughed and spaded soils. The topsoil was divided into three layers (A, B and C) using a computer programme. Horizon A comprises the top layer at a depth of 0 to 10 cm (0-3.94 inches), horizon B a depth of 11 to 20 cm (4.33-7.87 inches), and horizon C at a depth of 21 to 30 cm (8.27-11.81 inches). After this, the programme calculated the percentage of blue sand particles per horizon compared to the entire topsoil, so the number of blue sand particles of, for example, horizon A compared to all non-sand particles in the entire topsoil (A, B and C combined).
In image 1: soil visulation for ploughing, the practival image of the effect of ploughing on the soil can be seen. In addition, the plow depth is further highlighted in blue in the computer program.
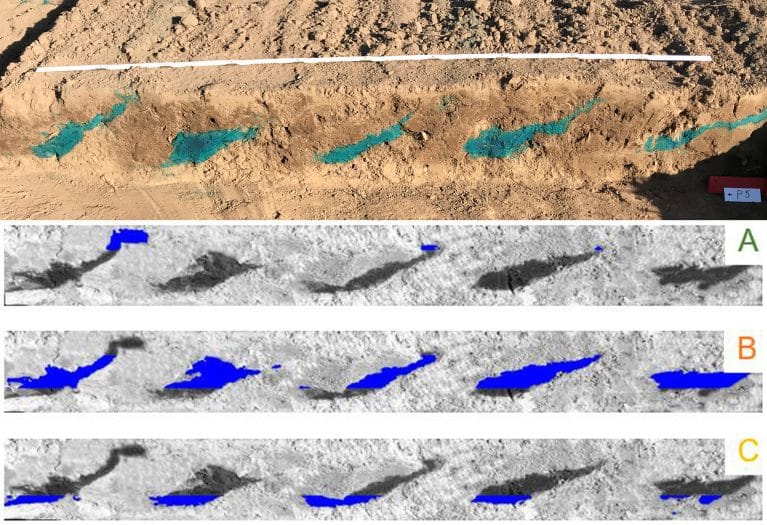
Image 1: Soil visualisation for ploughing. Horizont A (0-10cm), Horizont B (11-20cm) and Horizont C (21-30cm). Source: HS Osnabrück, Sandmann.
In image 2: Soil visualisation for spading, the practical image of the effect of spading on the soil can be seen. Based on the photo, a computer image was made featuring a subdivision in horizons.
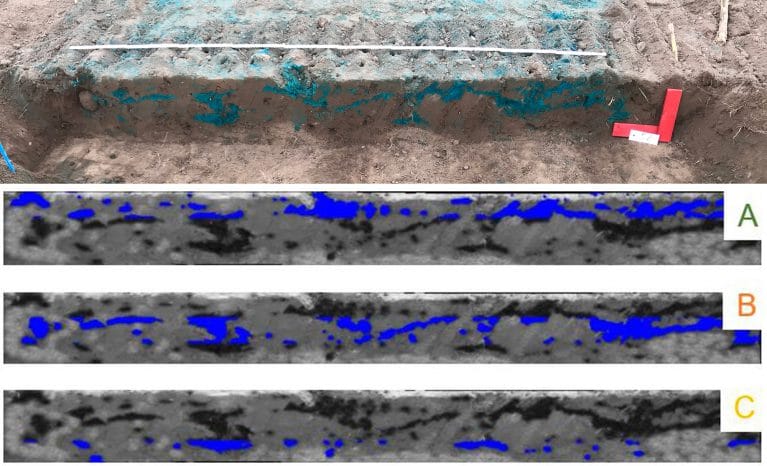
Image 2: Soil visualisation for spading. Horizont A (0-10cm), Horizont B (11-20cm) and Horizont C (21-30cm). Source: HS Osnabrück, Sandmann.
Chart 1: mixing percentage soil shows the mixed percentage of the horizons compared to the entire topsoil.
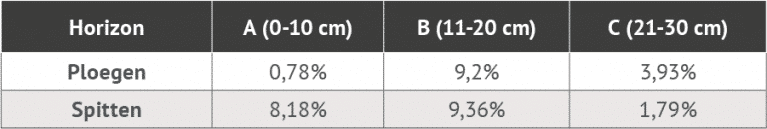
In total, the spading machine mixes over 20% of the topsoil, while a plough barely reaches 14%. Since the spading machine more evenly mixes the topsoil, crop remains & fertilisers are more effectively mixed through the entire topsoil. The crops benefit from this in the new cultivation season.
Images 3, 4 and 5, which show vertical cross sections made at depths of 5, 10 and 20 centimetres (1.97, 3.94 & 7.87 inches), show the mixing result of a plough and spading machine. It is clear that, in the top layer of the topsoil, the mixing performance of a spading machine is better than that of a plough.
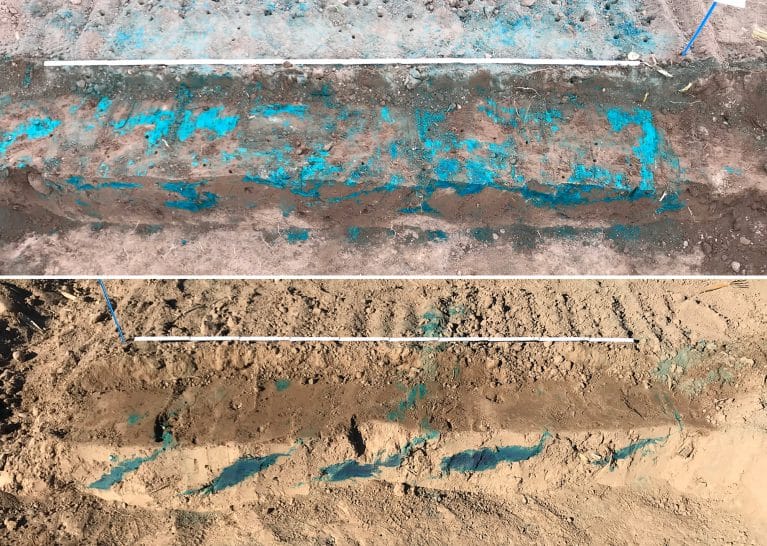
Image 3: vertical cross section at 5 cm (1.96 inches). Spading machine on top, plough below. Source: HS Osnabrück, Sandmann.
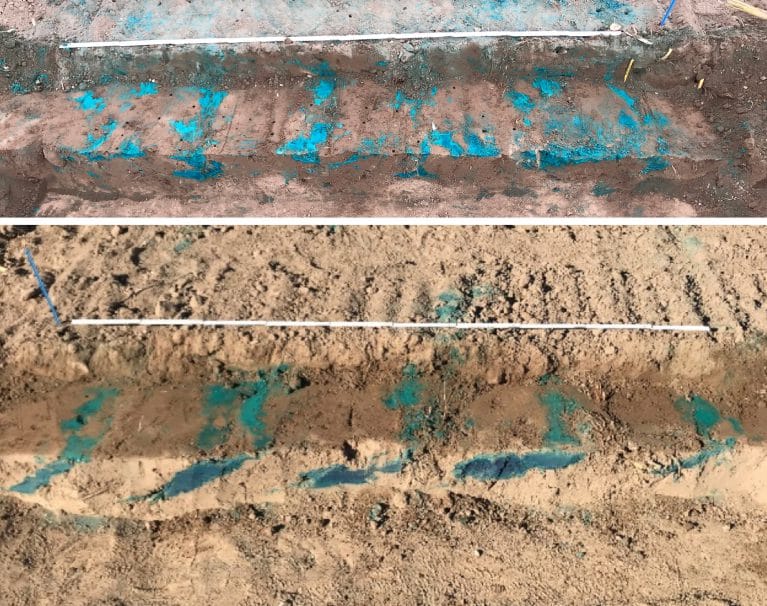
Image 4: vertical cross section at 10 cm (3.93 inches). Spading machine on top, plough below. Source: HS Osnabrück, Sandmann.
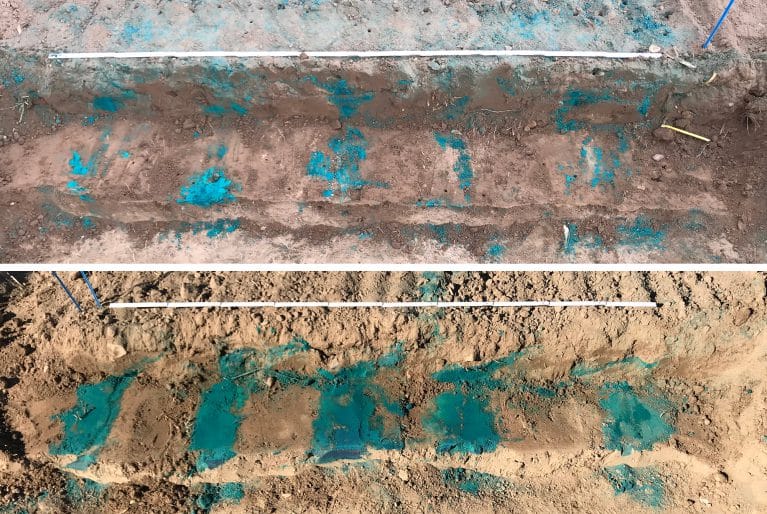
Image 5: vertical cross section at 20 cm (7.87 inches). Spading machine on top, plough below. Source: HS Osnabrück, Sandmann.
In addition to the research into the mixing performance of a spading machine and a plough, a converted yield increase was observed of almost 10% compared to the ploughed soil (ploughing: 9542 kg/ha & spading 10469 kg/ha). This yield increase depends on the soil type and weather conditions.
The soil preparation costs for the test company were also calculated by the study group. This cost calculation includes all costs, such as: depreciation costs, maintenance costs, diesel consumption (+AdBlue) and labour costs.
The study observed the following costs at the test plot:
- Hectare price for ploughing and sowing winter wheat: € 167.73
- Hectare price for spading and sowing winter wheat (spading-sowing combination): € 134.37
The cost difference for the test company was € 33.36 per hectare. This cost difference is due to the fact that spading and sowing can be combined, resulting in a reduction of labour and diesel costs. This is part of the reason why the combination of spading and sowing can result in a cost reduction of 15 to 20% per hectare.
The future
Next year, student Johannes Gründler of the Biberach University of Applied Sciences will perform research into the heavier soils in Southern Germany in order to research the effects of spading. In addition, the Osnabrück University of Applied Sciences will start research aimed at reducing the weight of the spading machine.
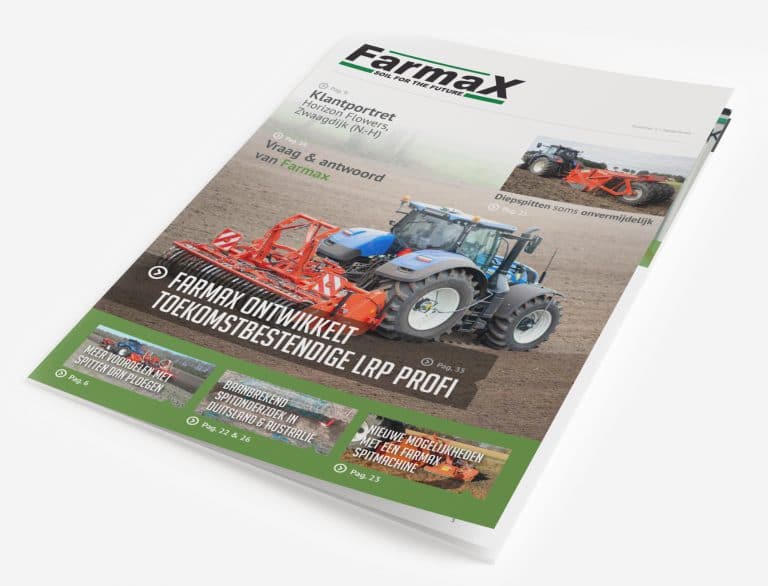
Download the free magazine of Farmax spaders and seeders
In this magazine, we will explain the spading method of soil preparation and state its advantages in comparison with ploughing. There will also be a brief explanation of all types of spaders and several customers share their experience with our spaders.